20 7481 4897")


 Italiano
Protecting Capital Equipment and Minimising Business Interruption
The use of vibration and performance monitoring data to detect emerging issues with rotating equipment is a longstanding practice within the power and energy industry. Recent improvements in the capability of the monitoring systems mean emerging issues are being detected earlier and many problems are identified before a complete failure occurs. Such failures include the bearings or gears within wind turbine gearboxes, and gas turbine engine bearings, blades, vanes, or other components in the gas path. Most rotating equipment systems incorporate alarm and trip limits, which help to prevent catastrophic failure and total equipment loss. However, these limits can act as a ‘green’ or ‘red’ light for operators to continue running their equipment and often by the time alarm and trip limits are exceeded, a failure has already occurred.
Traditional Vibration Monitoring
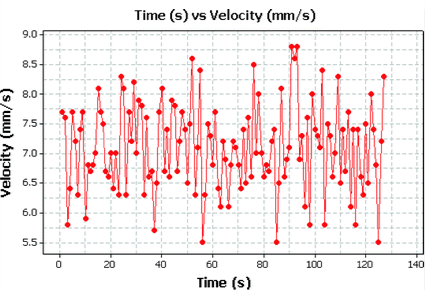
One of the limitations of traditional vibration monitoring is that the initial increase in vibration during the early stages of a failure is often minimal compared to the overall vibration level. Consequently, changes in behaviour can be difficult to detect. Figure 1 demonstrates a typical vibration trend for a piece of rotating equipment, where a machine operates with a ‘normal’ vibration level of 7 mm per second on average. The variation, or ‘noise’, in the signal is at least ± 1 mm per second. Therefore, if a bearing started to fail or a gear started to fracture, resulting in a vibration increase of 0.2 mm per second for example, the change would be almost impossible to identify by trending data.
Advanced Vibration Monitoring
There are a variety of instruments available for measuring vibration. One of the most common types used on rotating equipment is an accelerometer. This measures the acceleration of an object to which it is mounted. Data from the accelerometer is often recorded in units of mm per second, as shown in the trend in Figure 1. However, the measured acceleration at any one point is the sum of many individual forces over a range of frequencies. By applying Fourier analysis, the measured signal can be ‘deconstructed’ into its individual components and plotted in the ‘frequency domain’, an example of which is shown in Figure 2. Although there is a long history of using frequency domain data for vibration surveys, its use in continuous health monitoring in the power and energy industry is more recent. For gas turbine applications, advanced vibration monitoring can often be applied without the need for any new sensors.
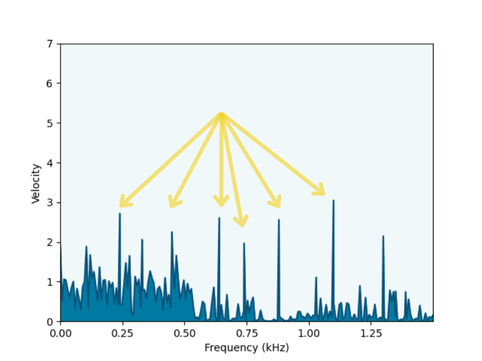
Each component in a rotating system contributes to the overall vibration at its own unique frequency. The total area under the line in the frequency domain plot in Figure 2 represents the overall vibration level at that moment in time. As previously highlighted, a small increase in the vibration of one component might not significantly increase the area under the curve and could therefore be too small to detect as an overall vibration increase using traditional continuous monitoring, for example as shown in Figure 1.
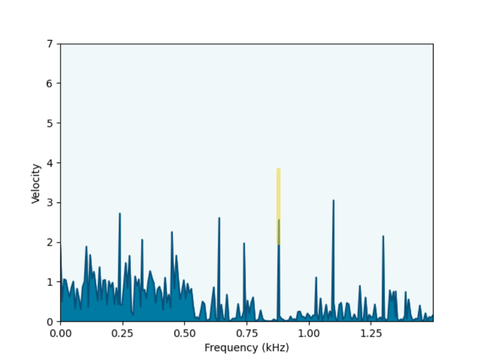
However, once the signal has been deconstructed into its constituent parts and plotted in the frequency domain, the increased vibration caused by an emerging failure might be very easily identifiable. An example of this is provided in Figure 3, where a vibration ‘peak’ at around 0.9 kHz has doubled in amplitude. This is clearly noticeable, even though the increase in the area under the whole plot, i.e. the overall vibration increase, is likely too small to be detected.
A further benefit of plotting vibration in the frequency domain is that equipment manufacturers know the ‘forcing’ frequency of different parts of a system. In addition to detecting emerging issues earlier, manufacturers can pinpoint the location in which a failure has occurred, based on the frequency at which a vibration increase is observed.
How Should the Information be Used to Assist Operators and Insurers?
Traditionally, when equipment fails or progressing failures are identified, equipment is typically removed from service for repair with the intent of minimising the overall damage and the consequential repair costs. However, due to the inability to plan and schedule the repair in advance, the equipment can become unavailable for several months following an unexpected failure. With recent developments in condition monitoring enabling emerging issues to be detected earlier, insurers, operators and forensic investigators need to consider the balance between business interruption and capital equipment repair cost when making decisions about when to remove equipment from service, when an issue has been identified. The following case examples highlight some of the factors that need to be considered when making that decision.
Case one- Wind Turbine Gearbox Failure
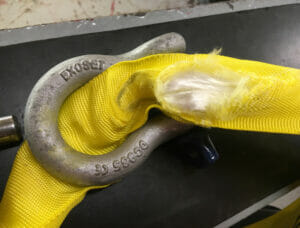
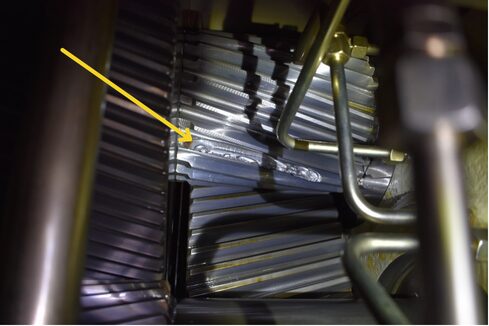
Image 1 shows a gear from a wind turbine gearbox with a broken tooth. This gear failure was detected by a service engineer who had climbed the tower of the wind turbine to carry out routine maintenance in the nacelle. Having noticed that the gearbox was making an unusual noise, the engineer stopped the machine and identified the broken tooth from a borescope inspection. No visible damage was detected on any of the other gears in the gearbox. The wind turbine did not have advanced vibration monitoring, and the failed gear was detected in a ‘traditional’ manner, after the failure had occurred. The wind turbine was unavailable for a period after the broken gear was identified, whilst a replacement gearbox, along with the lifting equipment, was awaited.
In more recent cases, wind turbine gearboxes have been removed from service where a cracked gear tooth has been detected by advanced vibration analytics, at which point the fracture was not visible to the naked eye. However, it is not currently known how many days, weeks, or months the gear could have continued operating before a failure would have been detected in the traditional way and therefore before the significant risk of the damage spreading. A medium-sized wind turbine might typically generate £75,000 a month in revenue. With the ability to detect problems earlier, if equipment could be left to run after new issues are first identified, operators and insurers could have the opportunity to minimise business interruption losses through scheduled repair planning, without significant risk of increased repair costs.
Case Two- Gas Turbine Vance Failure
This case occurred on a gas turbine engine that operated in a power station that competes in the peaking power generation market. The gas turbine monitoring showed a sudden but small drop in power output, combined with an increase in vibration. Both the performance change and the advanced vibration monitoring indicated that a problem had occurred in the high-pressure turbine.
The whole engine was inspected on-site using a borescope but, no damage was seen and normal operation of the unit continued. The fault detection was ignored and considered to be a ‘false alert’, and no repair work was scheduled.
Four weeks later, a larger reduction in power occurred, accompanied by a much bigger increase in vibration, which was detected by ‘traditional’ methods and alarm limits. The engine was once again inspected with a borescope, and on this occasion, significant damage was found. The engine was taken out of service and was returned to the workshop for a full repair. The initial failure was not seen during the first borescope inspection, because it had occurred in an area that was not accessible or visible by the borescope.

In this case, the gas turbine repair costs were around £0.5m to £1m greater than they would have been if the engine had been stopped when the failure was first detected, one month earlier. However, typical monthly business interruption losses for unavailable gas turbine engines could amount to many times that increase in repair cost. Therefore, the minimum financial impact would have been to schedule a repair for the earliest opportunity when the problem was first detected, i.e. 4 weeks earlier, which would have minimised the business interruption costs. The engine could have been allowed to continue operating after the initial problem detection, in the knowledge that if or when a failure did occur, the increased repair costs were likely to be lower than the saved business interruption costs.
Summary
Equipment failure in the power and energy industry can lead to both capital equipment repair costs and business interruption costs. Data analysis can provide a useful method of identifying the onset of a failure and, if acted upon quickly enough, can reduce the potential financial loss associated with the failure. With the introduction of advanced condition monitoring techniques, emerging issues and equipment failures can be identified earlier than they were previously. Insurers, operators and forensic service providers need to consider this information carefully on a case-by-case basis, when deciding how to balance capital repair costs with business interruption costs.
¹ Sunder Selwyn, T., Kesavan, R. (2012). Vibration Analysis of a Constant Speed and Constant Pitch Wind Turbine. In: Sathiyamoorthy, S., Caroline, B., Jayanthi, J. (eds) Emerging Trends in Science, Engineering and Technology. Lecture Notes in Mechanical Engineering. Springer, India.